Revenue Per Mile and Operating Ratio: Two Numbers Every Trucker Should Know
Most truckers know what a load pays. Fewer know whether the business is actually making money on it. Two simple numbers answer that: revenue per mile and operating ratio. Neither needs special software or an accounting degree, only your income, your expenses and your miles.
Revenue per mile
Revenue per mile is the money you earned divided by the miles you drove to earn it.
- Count every mile. Loaded miles and empty miles both go in the total. The deadhead to the pickup burned fuel and time, so it belongs in the number.
- Use one period. Take a month, a quarter or a year, and use income and miles from the same period.
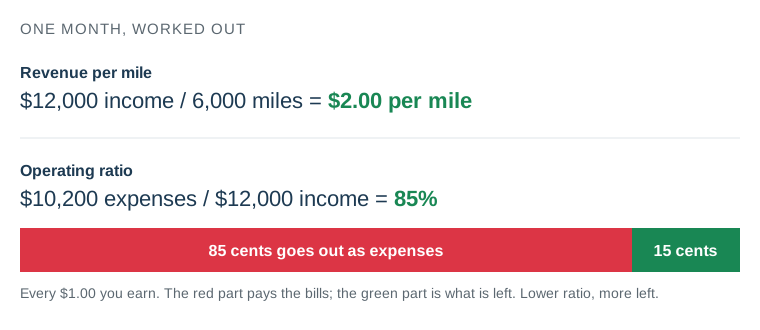
Example: you earned $12,000 in a month and drove 6,000 miles. Your revenue per mile is $12,000 divided by 6,000, or $2.00 per mile.
On its own, that number tells you very little. It matters when you set it beside what a mile costs you. The American Transportation Research Institute (ATRI) publishes an industry average each year; its 2025 figure was about $2.34 per mile for all carriers, as reported by Transport Topics. Your own costs will differ with your equipment, your lanes and whether you own or lease, so your own number is the one that counts.
Operating ratio
Operating ratio is the share of each dollar you earn that goes out the door in expenses.
Operating ratio = expenses divided by income, shown as a percentage.
Example: in that same month you spent $10,200 on fuel, maintenance, insurance and everything else. $10,200 divided by $12,000 is 0.85, so your operating ratio is 85%. You spent 85 cents to earn each dollar, and 15 cents was left over.
- Under 100% means you made a profit. Over 100% means you spent more than you earned.
- Lower is better. It is the opposite of profit margin: a profit margin of 15% is an operating ratio of 85%.
- What counts as healthy varies. Industry commentary often points to the high 80s or low 90s as a comfortable range for a small carrier, and treats a ratio that stays above 90% for months as a warning sign. Treat that as a rule of thumb, not a rule. Small carriers, owner-operators and large fleets all run at different levels.
Reading the two together
- High revenue per mile, high operating ratio. The loads pay well, but costs are eating the gain. Look at fuel, repairs and deadhead first.
- Modest revenue per mile, low operating ratio. You run lean. This can be a perfectly good business, and a few more dollars per mile would go straight to profit.
- Both slipping. Compare this quarter with last quarter. A trend over a few months is more useful than any single month.
Where to find them in Trip Sheet Central
The Profit and Loss report now shows both numbers. Revenue per mile and operating ratio appear in the boxes at the top, for the whole year and for any month you pick. Income is counted from your trips by pickup date, expenses come from your trip, business and maintenance records, and miles come from the trips you entered, so the numbers are only as complete as your records.

One thing to watch: a trip entered with no miles adds income but no miles, which makes revenue per mile look better than it is. If the number looks too good, check your trips for missing miles.